Roadway Fatalities by Substance Type

Drugs, alcohol, and a steering wheel. These ingredients don’t mix.
When you ignore this simple fact, the results can be fatal.
We analyzed data from the National Highway Traffic Safety Administration (NHTSA) that allow us to see all substance-related accidents leading to fatalities. Here’s what we found.
The Party States Aren’t The Problem States
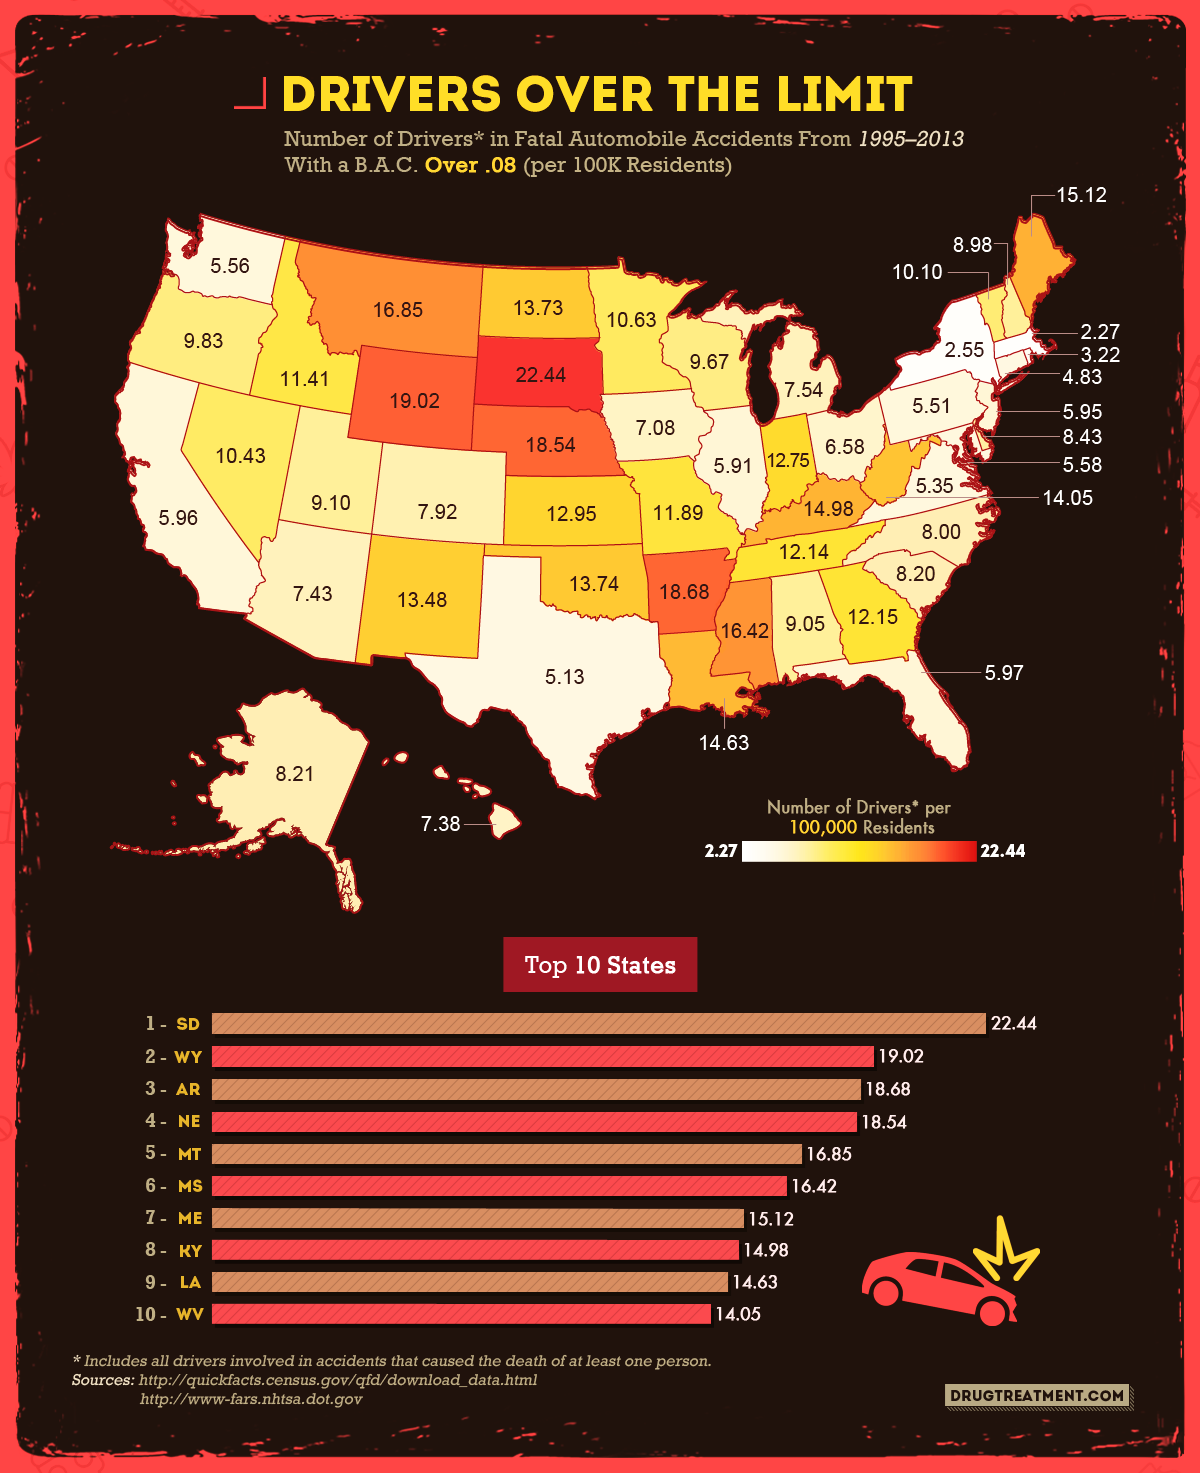
Check out this map. Here, you can see which states had the highest average number of fatal automotive accidents involving a driver with a B.A.C. above 0.08. You might expect states like New York and California – known for extravagant nightlife – to have the highest averages.
While these states certainly charted in these tragic metrics, it was South Dakota that ranked first on the list, with other states in the Mid and Northwest such as Wyoming, Nebraska, and Montana, and Southern states such as Arkansas, Mississippi, and Louisiana, following closely behind with the highest number of fatalities.
Drugged Driving Is as Deadly as Drunk Driving
Mixing alcohol with driving isn’t the only deadly combination out there. Taking the wheel under the influence of drugs is also a dangerous gamble.
That’s a lesson some paid the ultimate price for.
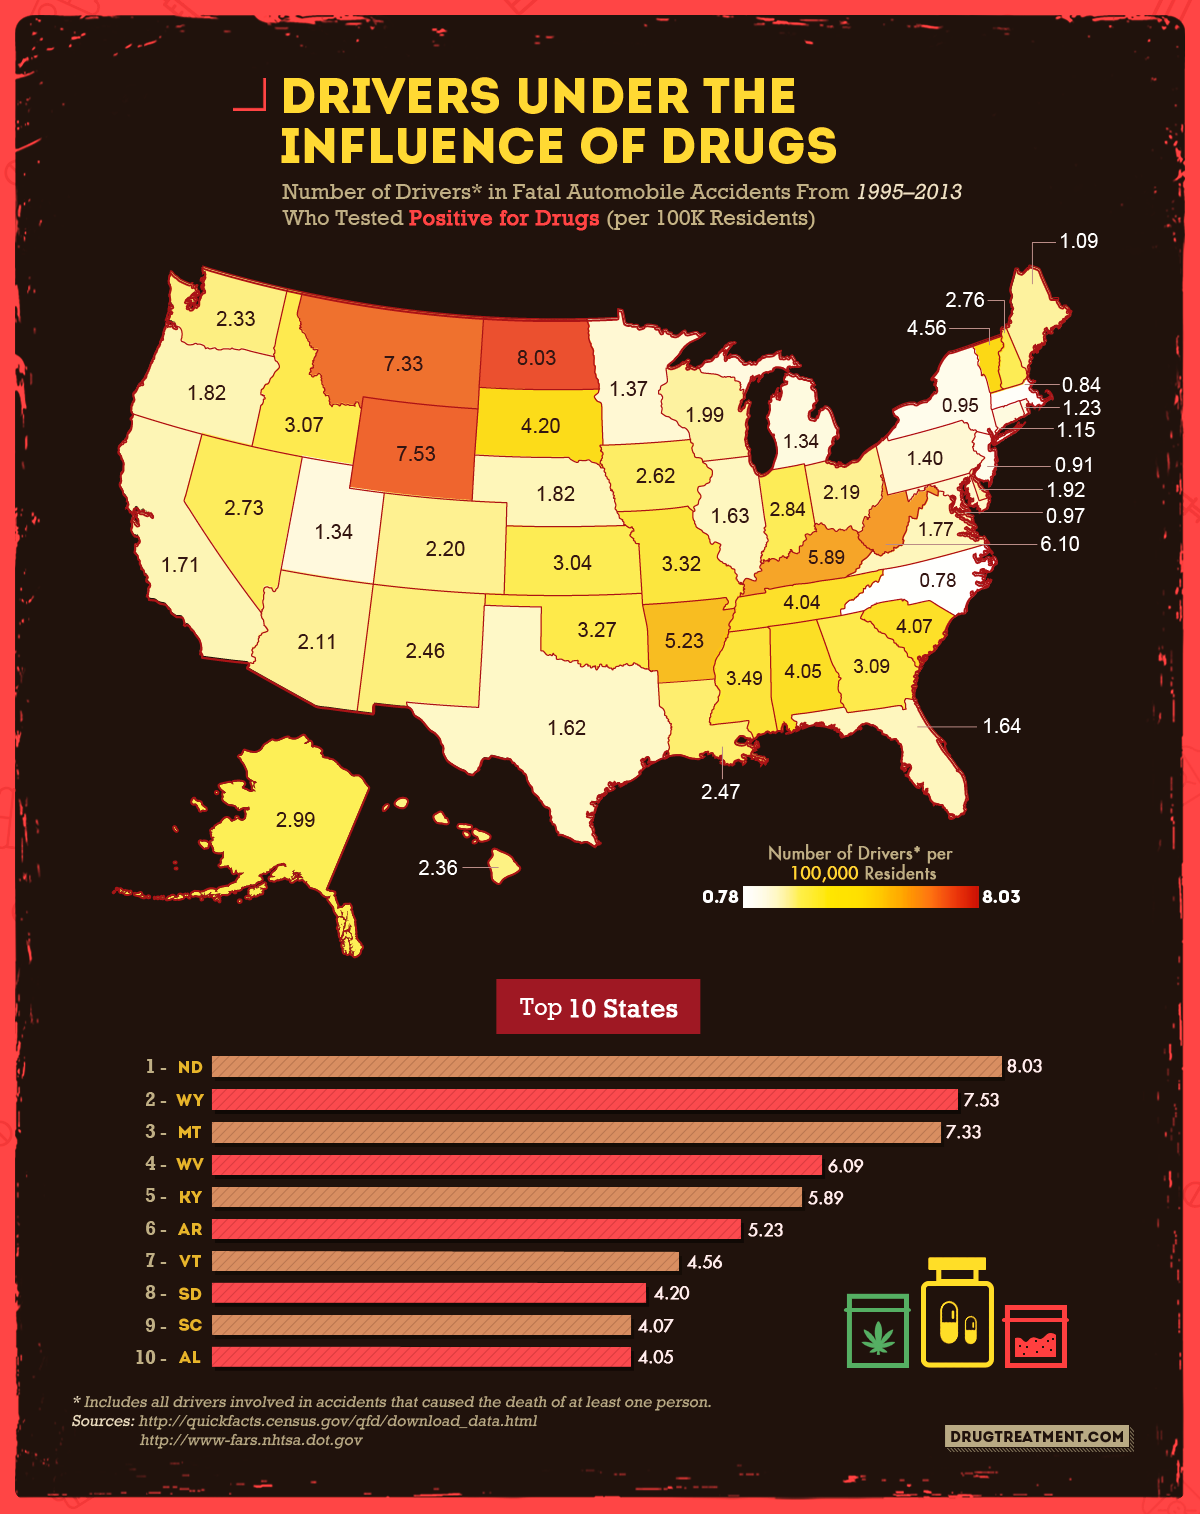
As with drinking, deaths stemming from drug-fueled accidents occurred more often in the same areas that were hotbeds for drunk driving accidents, though fatal drugged driving accidents were less prevalent than fatal drunk driving accidents.
North Dakota, Wyoming, and Montana were three states that had the highest averages of drug-related traffic fatalities.
The Men Die Young
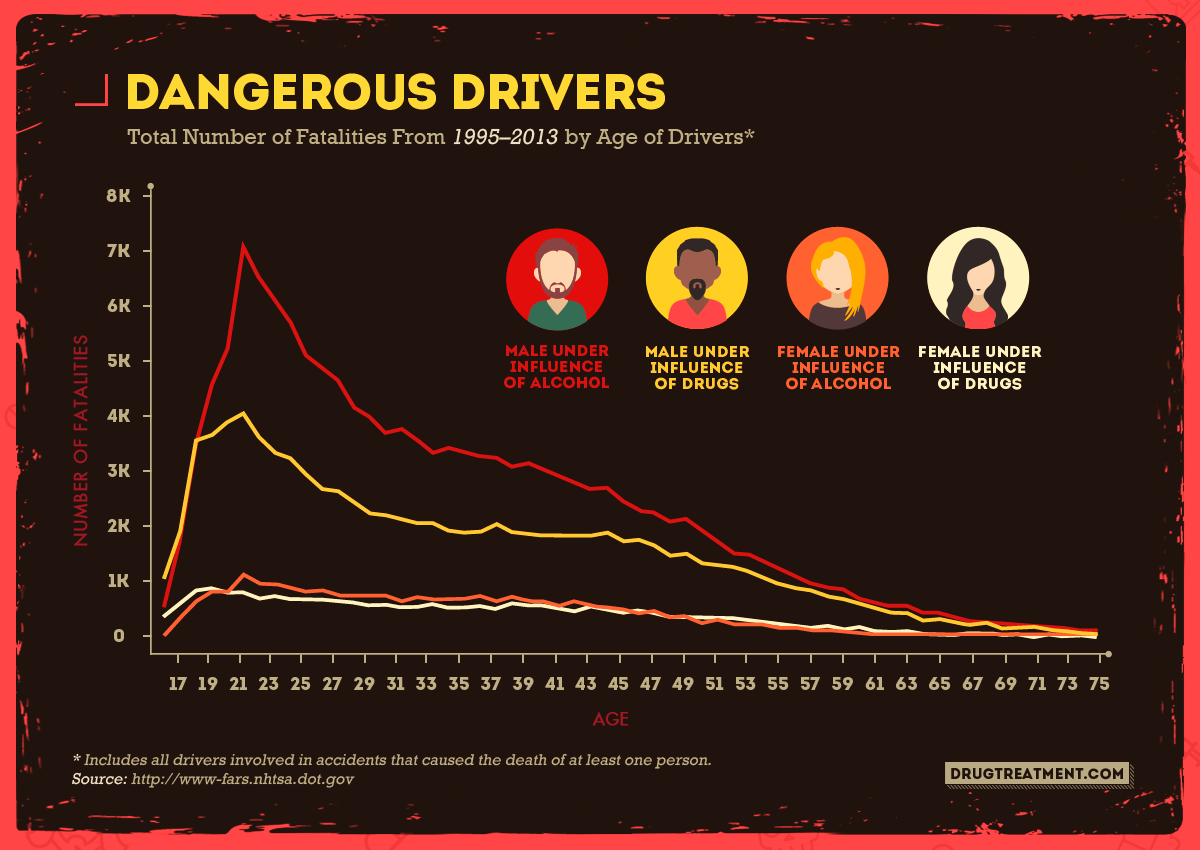
With a deeper look into the pattern of deadly driving, something really sticks out: Males, at age 21, were about seven times more likely to be involved in a fatal drunk driving accident than women of the same age.
Though the ratio is never as startlingly high as they grow older, the grim trend never wavers. Men are more likely to find themselves in a fatal drunk driving accident than women throughout their entire lives.
Men between the ages of 19 and 29 were the group most likely to be involved in these types of accidents. As men age, we see the number of incidents decline drastically. As women age, the number of accidents drop as well, but the difference between the number of women at age 48 involved in a fatal drunk driving accident and the number of women at age 24 isn’t but a few hundred. Compare that to a few thousand with men.
Driving Stoned Isn’t Safe Either
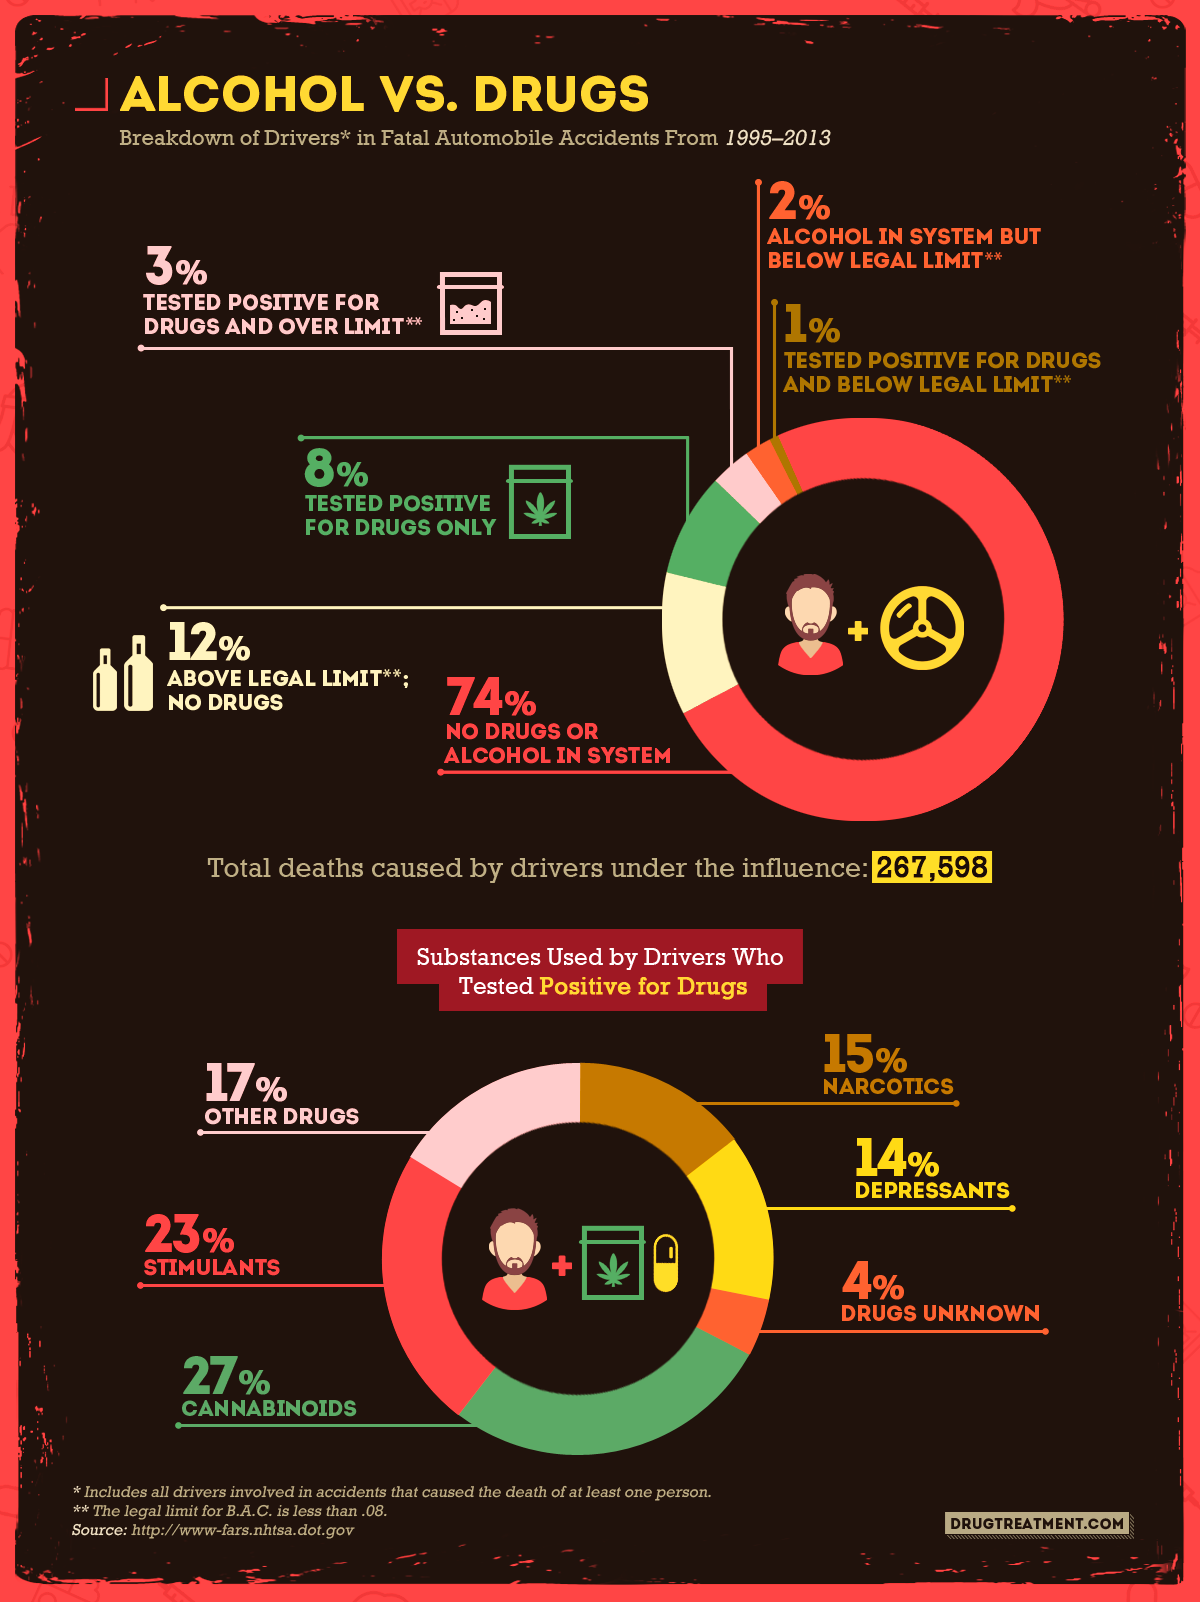
According to the NHTSA, it’s supposedly safer to drive stoned than drunk. Still, that doesn’t mean it can’t be fatal. In fact, when it came to drivers who tested positive for drugs, it was marijuana that was most often involved in fatal accidents. Also defying perception, stimulants – which you would think would at least keep drivers alert; these substances were the second most often involved.
Illicit drugs were the sole factor in 8 percent of fatal auto accidents between 1995 and 2013. When you add in incidents in which a driver was drunk, substance-related accidents account for over 25 percent of fatal traffic accidents, claiming 267,598 lives over that time period.
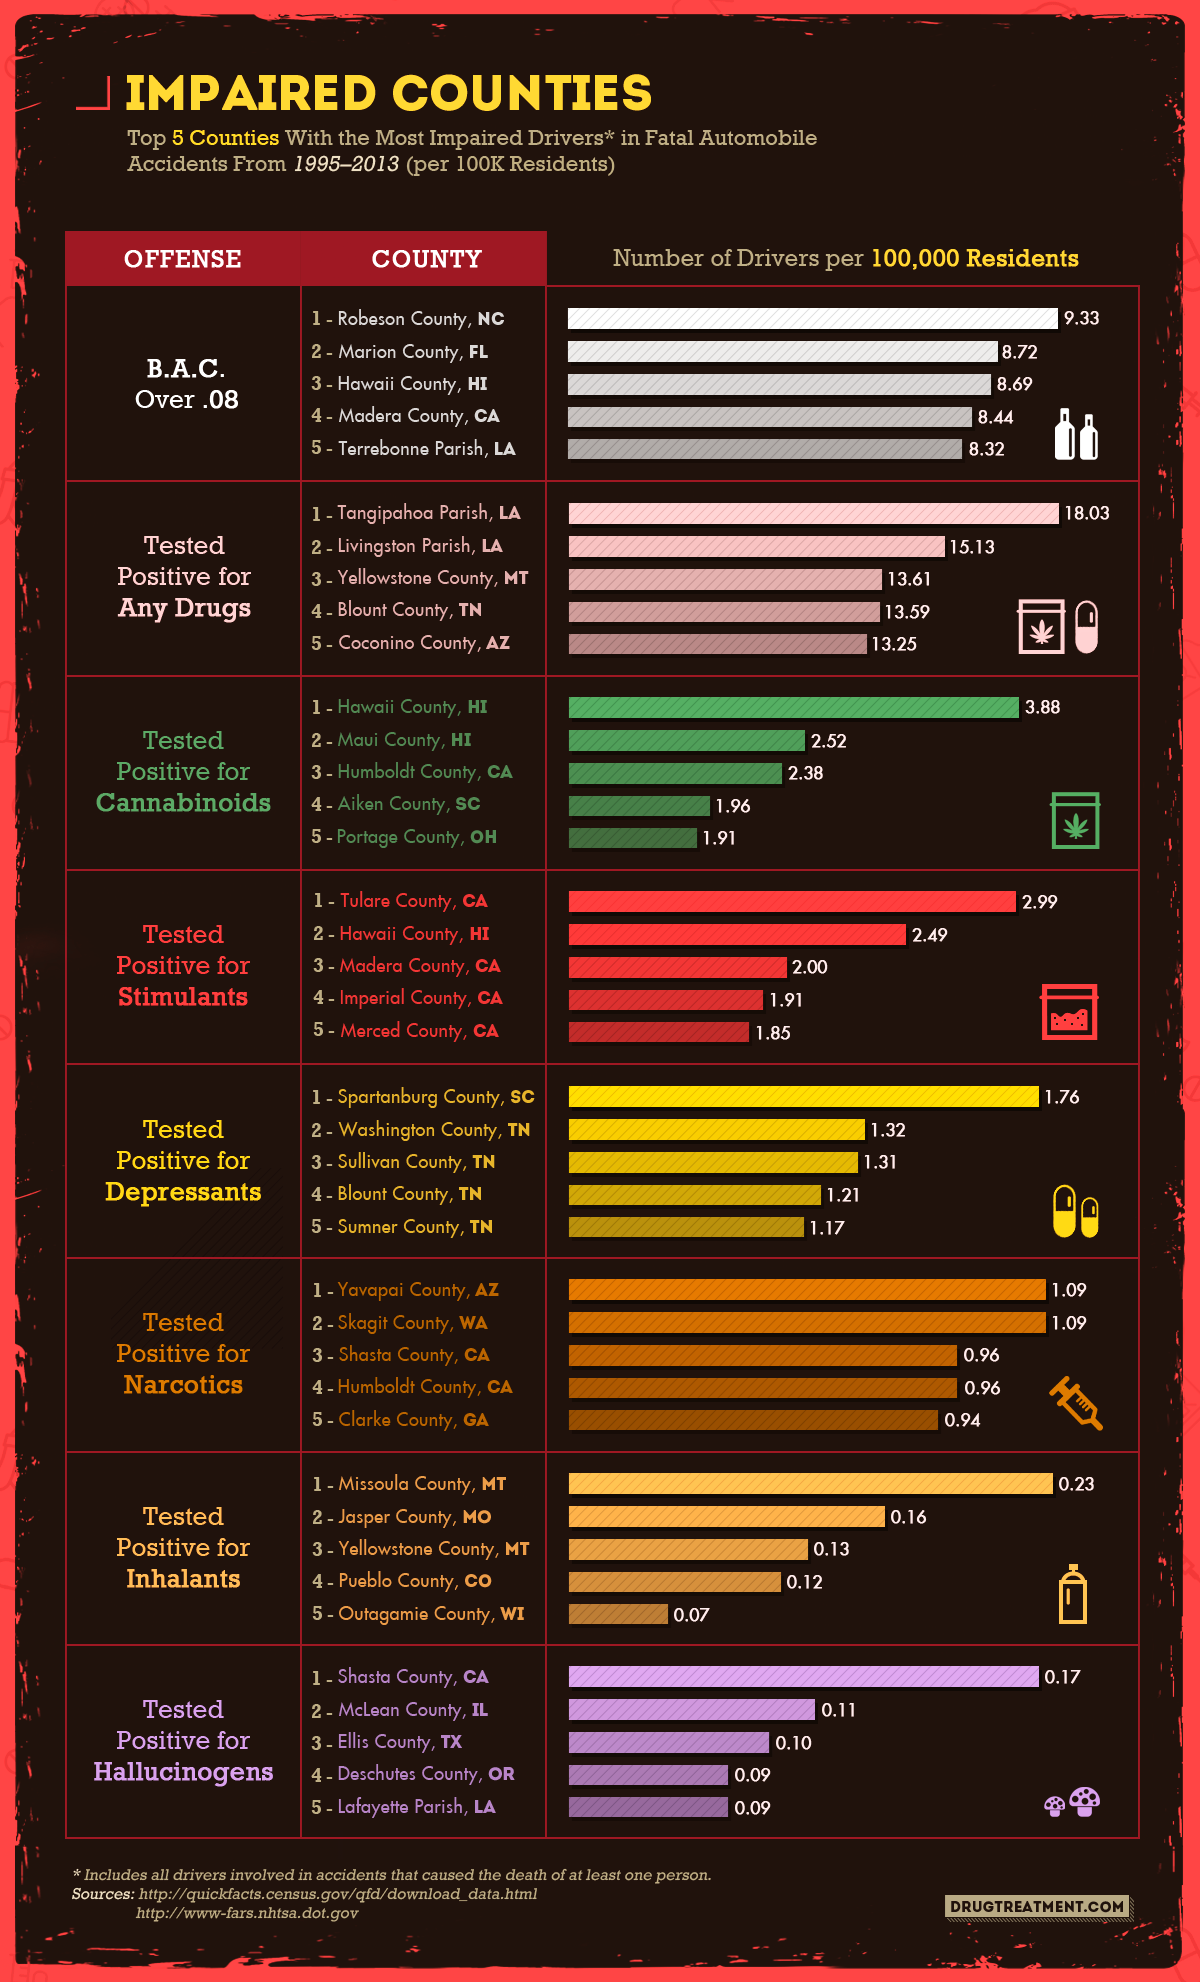
Certain States Favor Certain Drugs
Here, we look at the breakdown for U.S. counties and parishes where those involved in a fatal accident tested positive for a substance.
Overall, Louisiana had the top two parishes for drug-related automotive deaths. When you begin breaking down the numbers, you can see some even more interesting trends in the locales.
Tennessee placed four counties in the top five nationally for deaths related to driving under the influence of depressants. Conversely, California is home to four counties in the top five for stimulants. The Golden State also features a county in the top five for most deaths related to driving under the influence of hallucinogens.
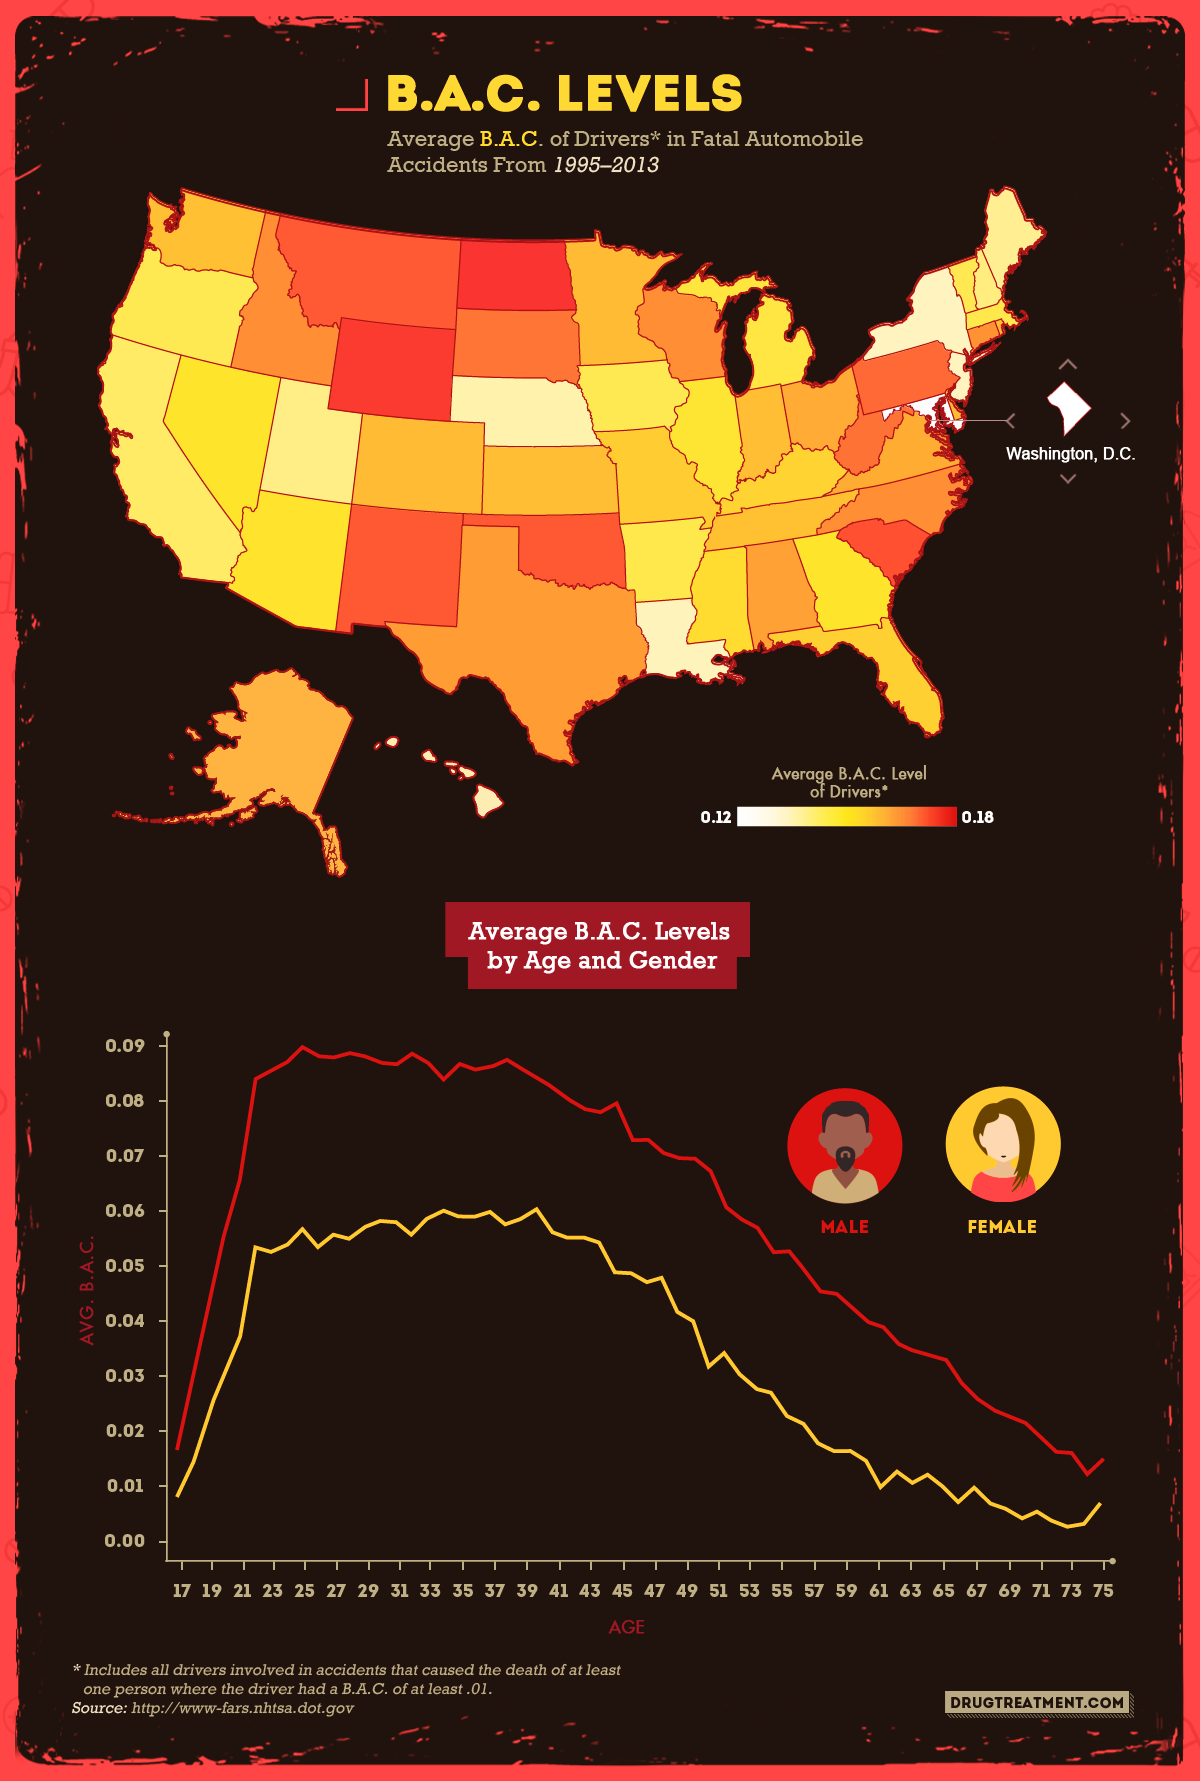
The Drunkest Drivers Were in Rural States
It’s rural states like North Dakota, Wyoming, and Oklahoma, plus South Carolina and New Mexico, that chart high for drivers with the highest B.A.C. levels in fatal accidents. Why these states? Rural settings lend themselves to drunk driving. A lack of public transportation, added to the greater distance between a bar and a bed, create a greater temptation to drive drunk. North Dakota, Wyoming, and Oklahoma rank as three of the most rural states in the nation. Wyoming is No. 1.
As you can see, it doesn’t take much alcohol to cause a fatal accident. The average B.A.C. level in an alcohol-related traffic fatality maxes out at about .09. That’s just one-hundredth of a percentage point above the legal limit.
In keeping with the other findings, it was young men who died on the road with the highest average B.A.C. levels. As age increases, average B.A.C. levels in auto accident deaths generally decrease.
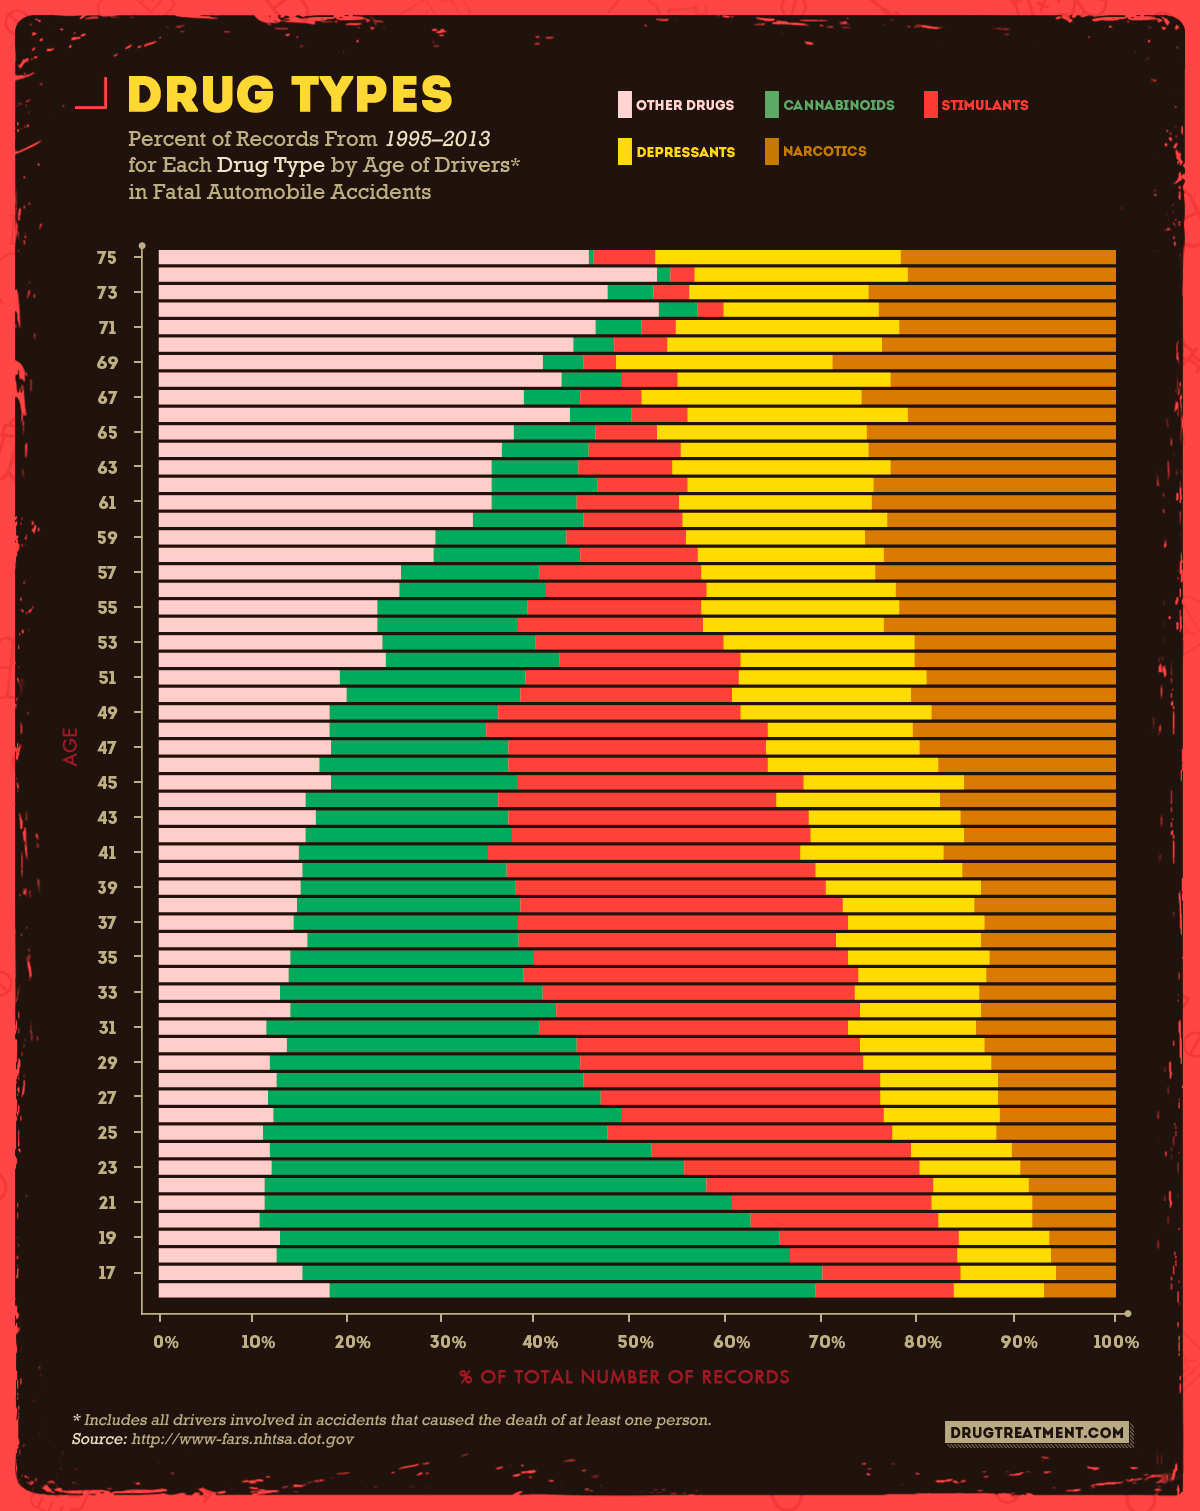
The Age Effect on Drugs
Next up: A glimpse across age groups and the proportion of all fatal car accidents at each age level that are influenced by different drug types.
Marijuana was the drug of the young – and not in a good way. We can see here most traffic fatalities from ages 17–27 stem from marijuana.
However, as people enter their 30s and 40s, stimulants become the primary culprit.
As people enter their 50s and 60s, marijuana diminishes to an extremely low incidence, as do stimulants. Instead, other drugs and depressants are the dominant categories, while the incidence of narcotics also rises. As people enter their 70s, drugs other than cannabinoids, stimulants, depressants, and narcotics play a role in nearly half of substance related traffic fatalities.
As people grow older, the drugs they may use change. Instead of recreational marijuana, the trend is toward prescribed medications of all varieties.
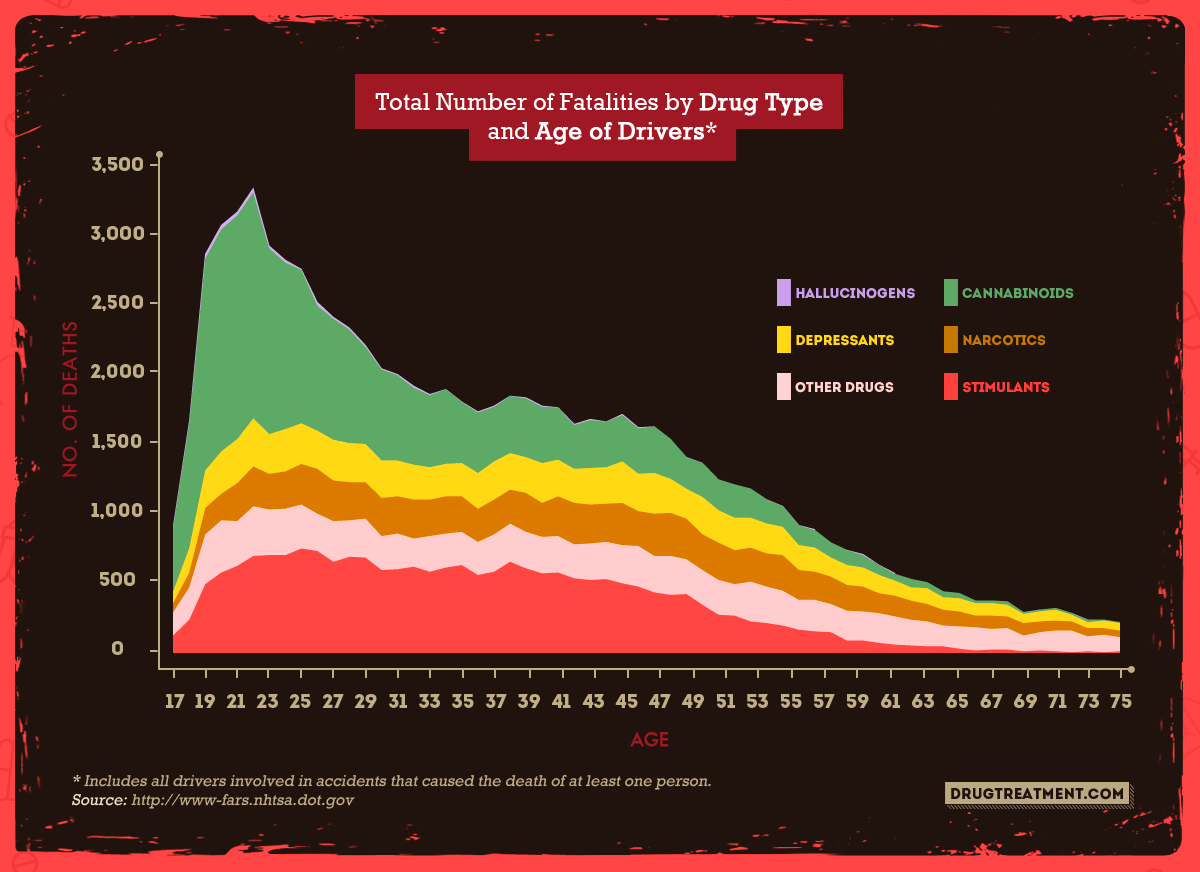
Age and Accidents: An Inverse Correlation
As people age, the overall incidence of fatal drug-related traffic accidents decreases dramatically.
Case in point: Over the last two decades, we’ve seen more than 3,000 such deaths at age 21, compared to half that at age 49. At age 75, the number falls below 500
So of almost all fatal traffic accidents, many will occur at an early age. This is possibly why, despite its waning incidence as age increases, marijuana is still the No. 1 most common drug involved in a fatal accident.
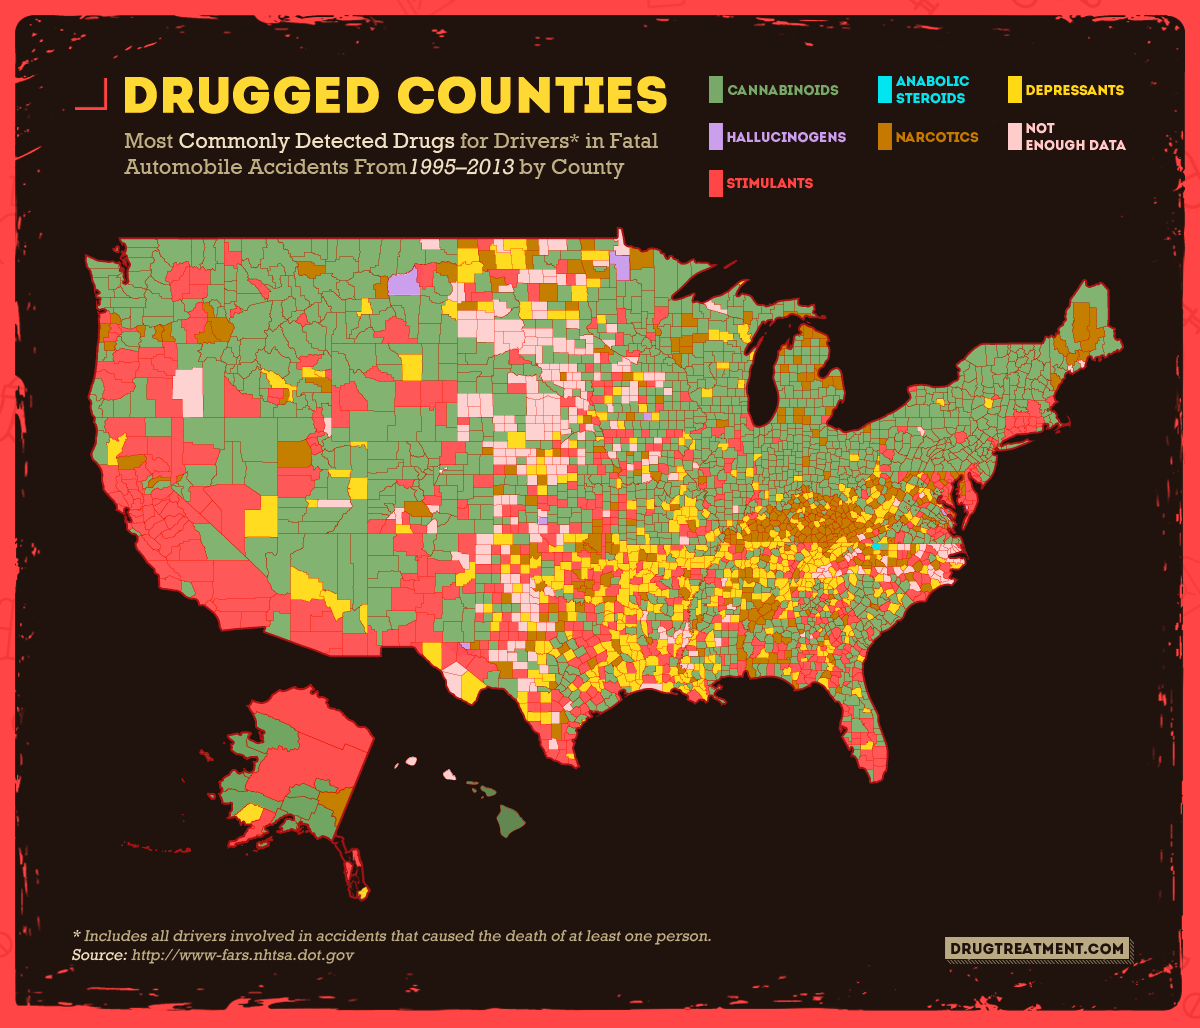
Marijuana and Motors Don’t Go Together
The map above shows a lot of red. It represents counties where the No. 1 drug involved in fatal accidents was marijuana. If you were thinking you’d rather drive high than drive drunk, how about this one? Don’t drive at all.
Getting behind the wheel after smoking marijuana can kill you, your friends riding with you, or another driver, as evidenced by the fact that marijuana was the most common substance involved in drug-related traffic fatalities.
Is It Worth the Risk?
When you get behind the wheel after a night of drinking or taking drugs, you’re putting your life on the line. And not only your life but the lives of people you’ve likely never met.
So the next time you think you’re in the mood to gamble, just ask yourself: What if you lose?
Traffic fatalities secondary to substance use are just one of many examples of the disastrous effects that drugs and alcohol can have on all of us.
Insurance Providers with Treatment Coverage
- Aetna
- Amerigroup
- Anthem
- Blue Cross Blue Shield
- Cigna
- Humana
- Kaiser Permanente
- Medicare
- Tricare
- United Health Group
If you’re concerned that substance abuse is placing you or a loved one in danger, please call 1-888-851-2649 Who Answers? . Treatment support professionals are ready to answer questions and help those in need to explore alcohol and drug recovery options.
Methodology
We sorted through the Fatality Analysis Reporting System (FARS) from 1995 to 2013 to determine which U.S. states have the most drug- and alcohol-related fatal automobile accidents. We catalogued the data for every driver involved in a fatal accident and determined the number of fatalities caused by each substance as well as which substance was involved in the highest number of fatal accidents in each county.
Drug presence includes illicit substances as well as prescription medications and means only that the substance was found in the driver’s system. Unlike alcohol data, the amount of drugs present isn’t measured. Alcohol, aspirin, nicotine, and any drug administered after the accident are excluded.
Sources
- http://www-fars.nhtsa.dot.gov/Main/index.aspx
- http://quickfacts.census.gov/qfd/download_data.html
- http://www.dmv.org/automotive-law/dui.php
- http://www.nhtsa.gov/staticfiles/nti/pdf/812118-Roadside_Survey_2014.pdf
- https://news.google.com/newspapers?nid=1807&dat=19941108&id=yaIcAAAAIBAJ&sjid=DnAEAAAAIBAJ&pg=3912,3627667&hl=en
- http://www.census.gov/geo/reference/ua/urban-rural-2010.html